Episode 1: Build Your Own Budget Tracker — Without Writing a Single Line of Code
Series: Hire an AI Developer Reading Time: ~15-20 minutes Difficulty: Beginner — if you finished Episode 0, you're ready
In 15 minutes, you'll go from a bank statement CSV to a fully interactive budget dashboard running on your computer — and you won't write a single line of code.
Before You Start
Make sure you've completed Episode 0:
- Your Claude account is set up (Pro subscription or Console credits)
- Claude Code is installed and working in your terminal
- You've confirmed it responds (the "handshake" test)
- If using Console credits: ~$1-2 is all this tutorial will cost. If on a Pro plan, it's included.
Good? Let's build something.
Why This Matters
You've downloaded your bank statement. It's a mess of numbers. You paste it into a spreadsheet and stare at it. Where's your money actually going?
You could spend an hour building formulas. Or you could Google "budget template" and try to force your data into someone else's format.
Or... you could say "build me a budget dashboard" — and get one.
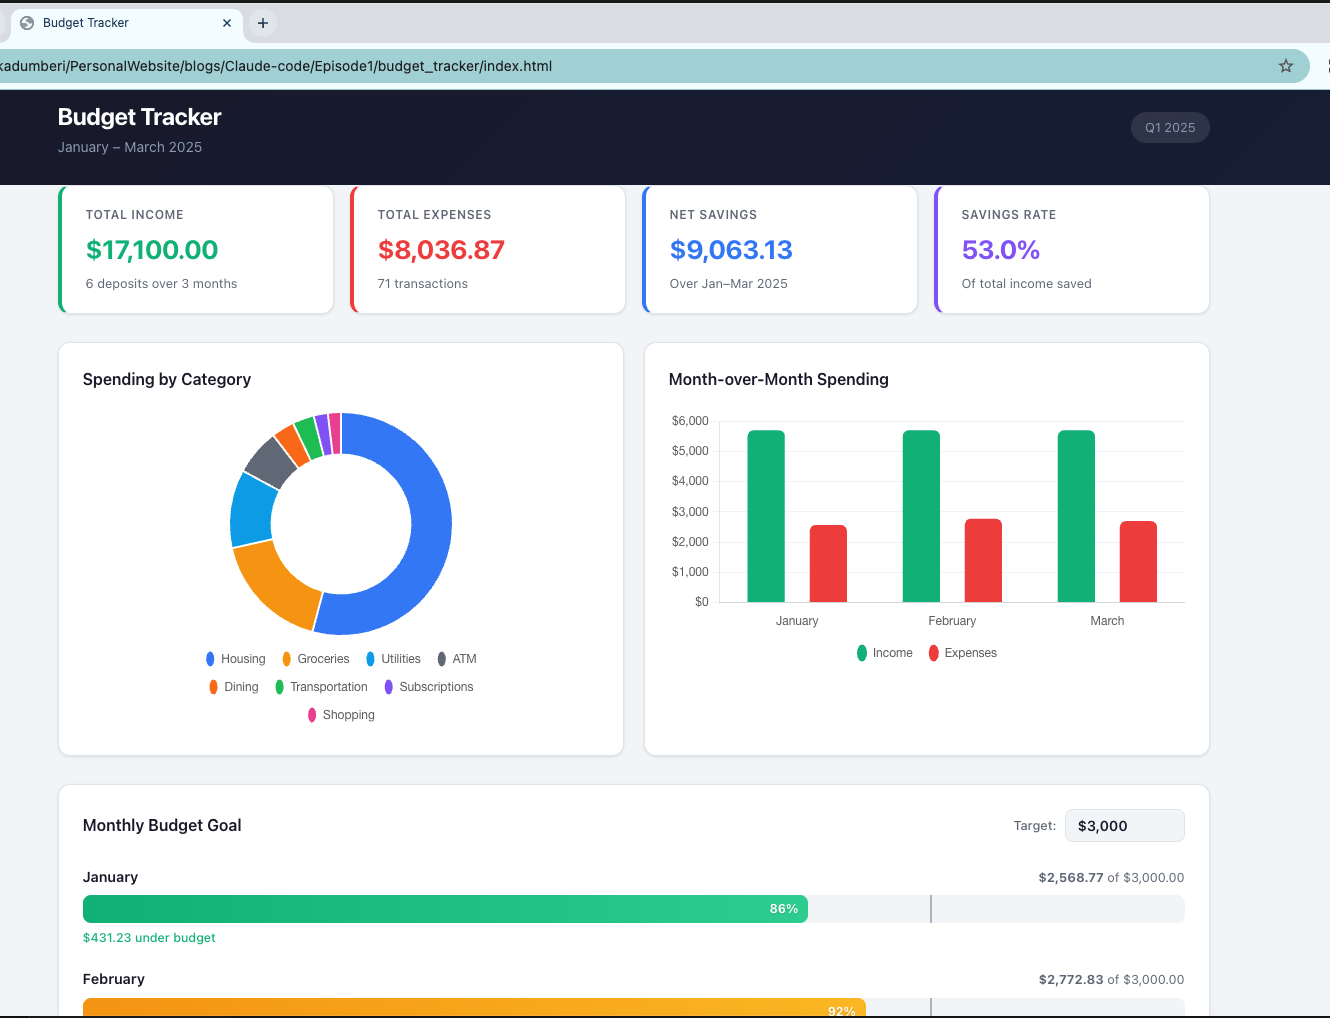
Today, you're going to delegate your first real project to your AI developer. By the end, you'll have a fully interactive app that looks like this:
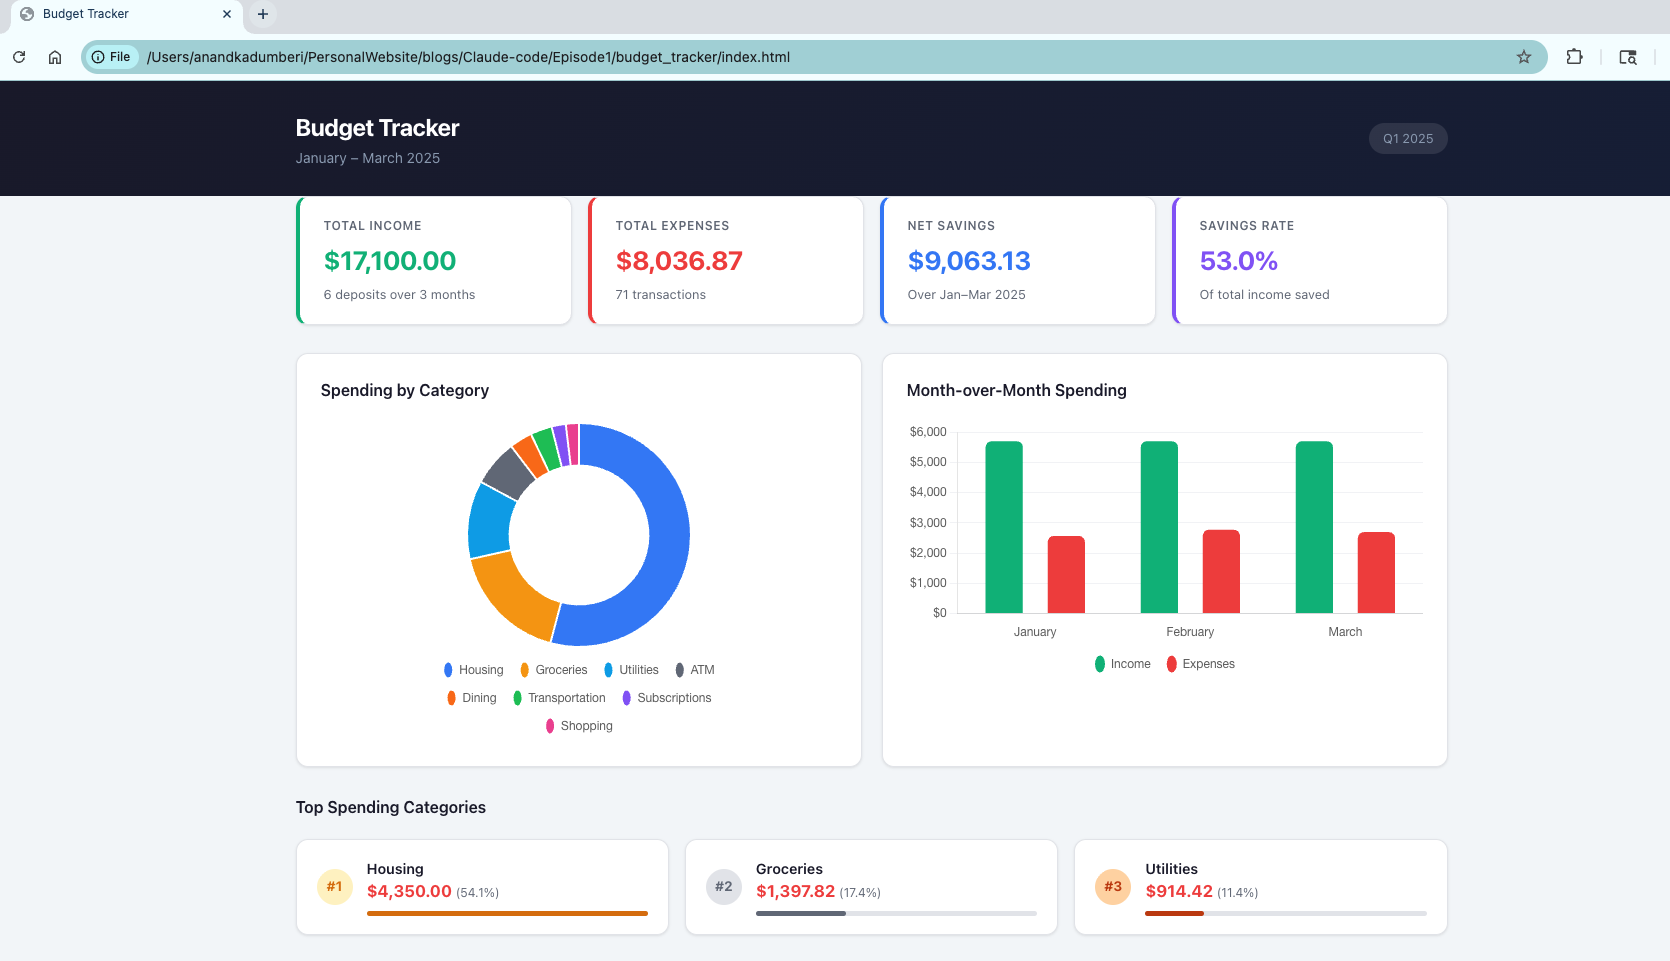
This is an interactive prototype that you can run right in your browser. And you're about to build it.
Step 1: Brief Your Developer — Create Test Data
We're going to start with fake bank data. Why? Because we want to learn the process without worrying about real financial information. Plus, this step is itself a small "wow" moment — you're about to watch Claude Code generate realistic data out of thin air.
Open your terminal and go to your projects folder:
cd my-projects
Create a new folder for this project:
mkdir budget_tracker
cd budget_tracker
Think of this as setting up a workspace for your developer. Everything for this project lives here.
Now launch Claude Code:
claude
Give it your first instruction:
Copy and paste this into Claude Code:
Create a realistic sample bank statement CSV file with 3 months of
transactions (January to March 2025). Include a mix of:
- Regular income (salary deposits twice a month)
- Rent/mortgage payments
- Groceries from different stores
- Restaurant and coffee shop visits
- Subscription services (Netflix, Spotify, gym)
- Utilities (electric, internet, phone)
- Gas station visits
- Some Amazon purchases
- A few ATM withdrawals

Make it realistic with varying amounts and dates. Include columns for
Date, Description, Category, Amount (negative for expenses, positive
for income), and Running Balance. Start the balance at $4,250.
Save it as bank_statement.csv
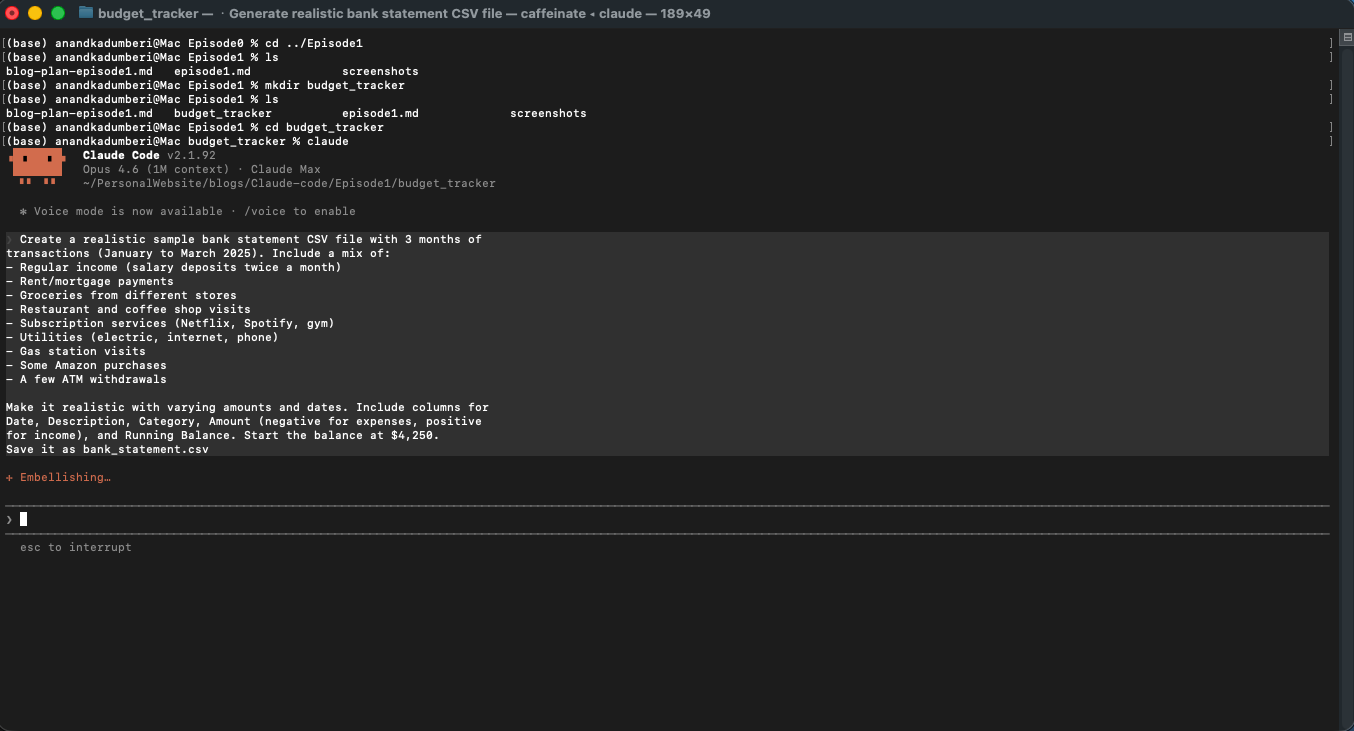
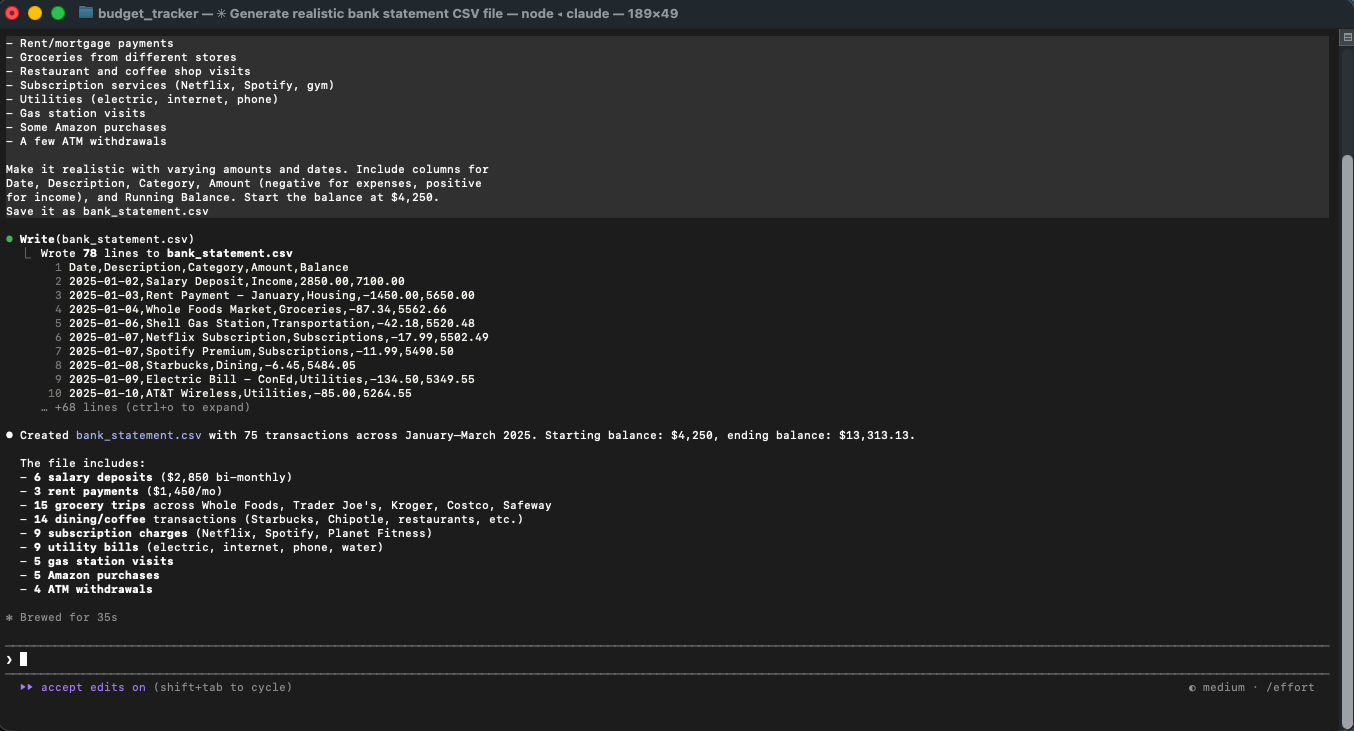
Hit Enter and watch.
Claude Code will think for a moment, then create a file called bank_statement.csv in your folder. Just like that — you described what you wanted in plain English, and your developer made it.
Take a peek at what it created
You can ask Claude Code to show you the file:
Show me the first 20 rows of bank_statement.csv
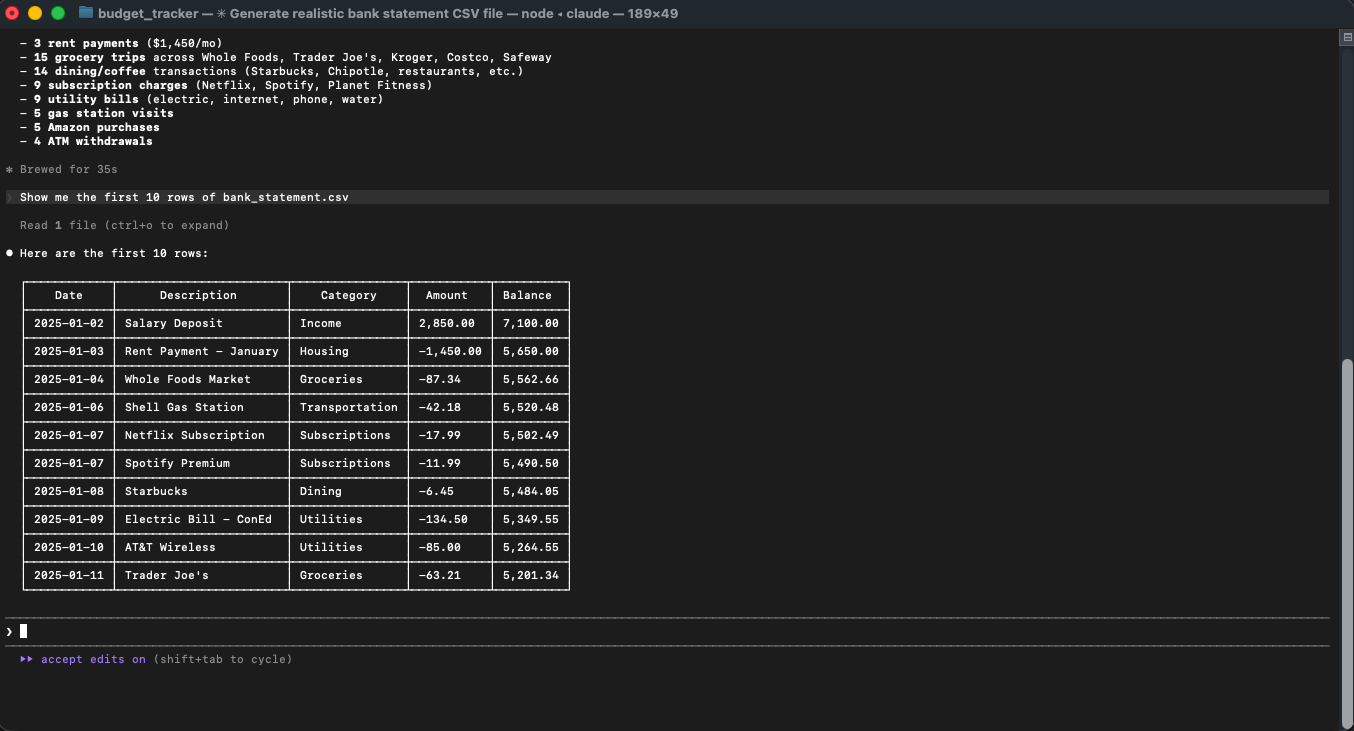
Look at that. Realistic dates, varying amounts, different merchants. It even kept a running balance. You didn't write a formula, didn't build a spreadsheet. You just described what you wanted, like you'd tell a colleague.
That's the mental model. You describe. Claude Code builds. Remember this — it's how everything works from here on.
Step 2: The Big Ask — Build the App
This is the moment. You're about to give Claude Code one instruction, and it's going to build you a full interactive prototype.
Copy and paste this prompt:
Using the bank_statement.csv file in this folder, build me a personal
budget tracker as a single-page web application (one HTML file with
everything included).

It should have:
- A clean, modern dashboard layout
- A summary section showing total income, total expenses, and net
  savings for the full period
- A breakdown of spending by category shown as a visual chart
  (pie or donut chart)
- A month-over-month comparison (bar chart showing spending per month)
- A transaction table where I can search and filter by category or date
- A "top spending categories" section highlighting where most money goes
- Color coding: green for income/savings, red for overspending,
  neutral tones for everything else

Make it look professional and polished. Use a modern sans-serif font.
The whole thing should work by just opening the HTML file in a browser.
No server needed. No installation needed. Just open and use.
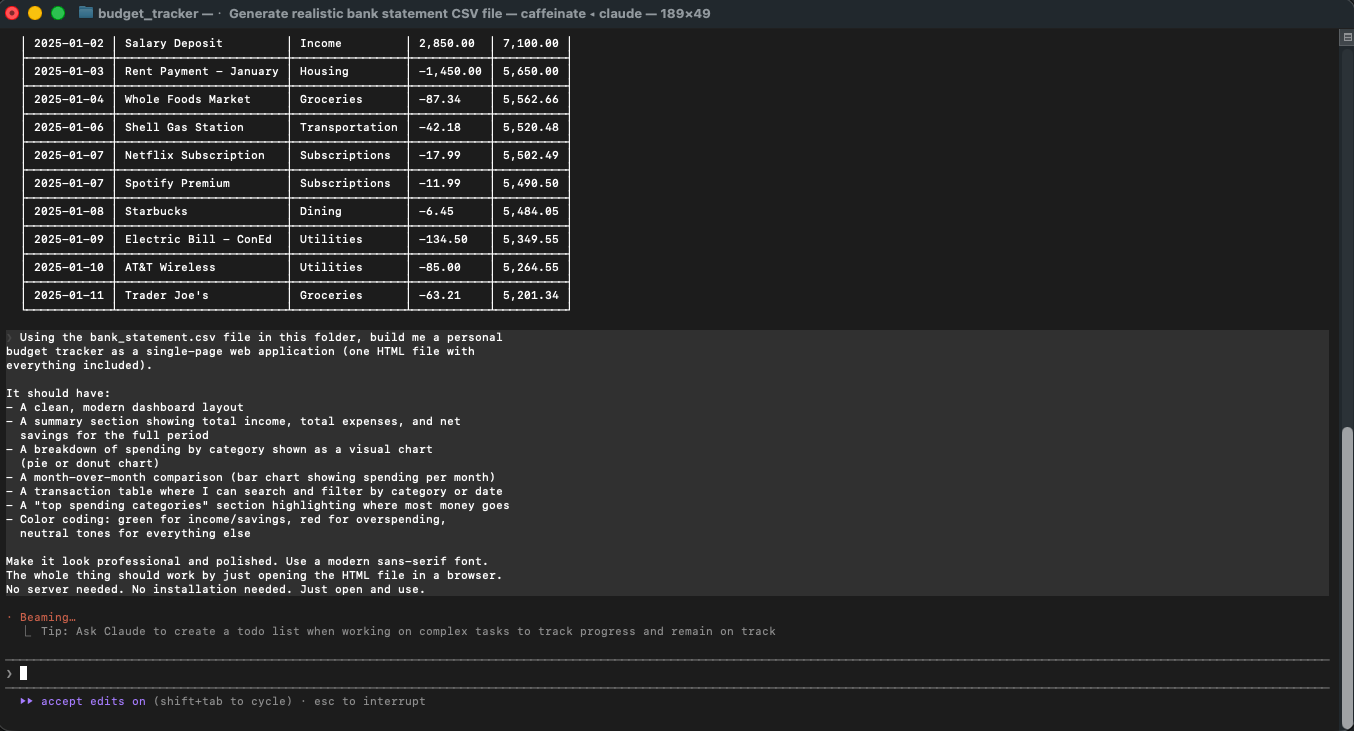
Hit Enter.
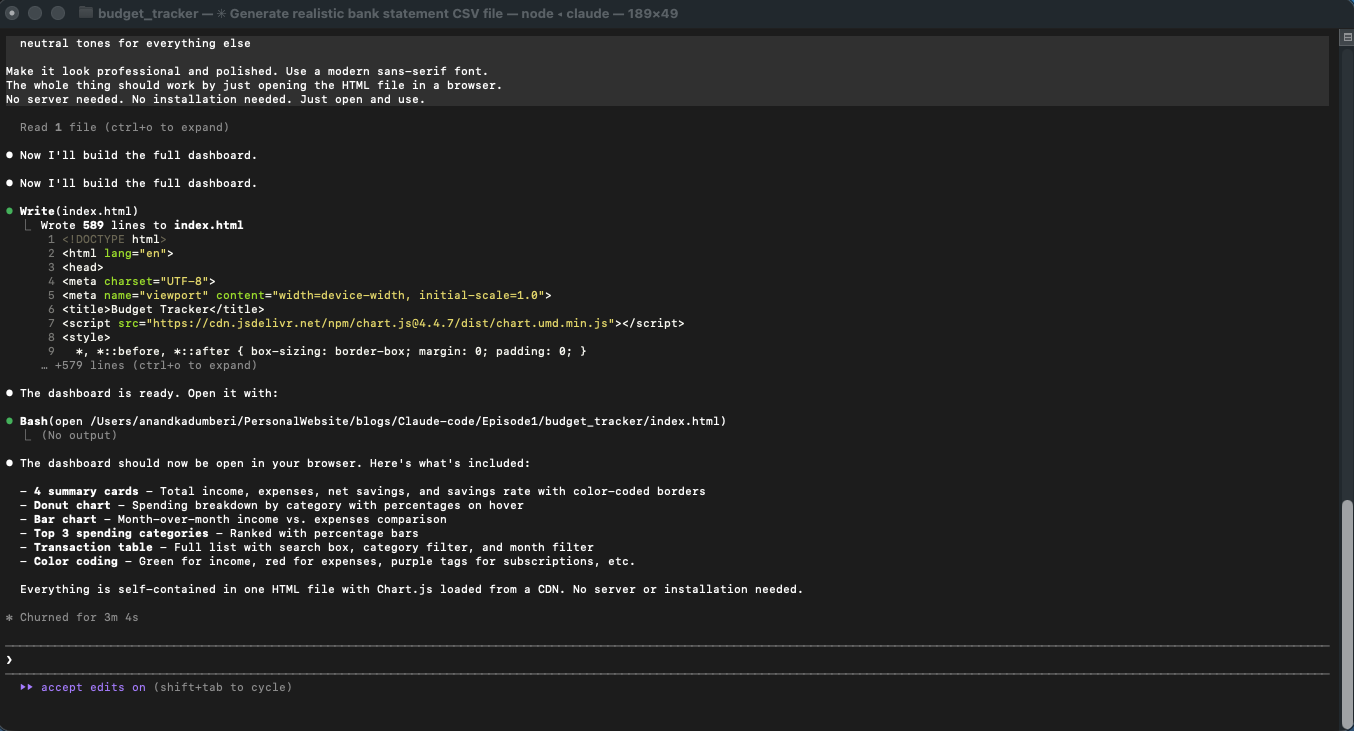
Now watch your screen. Claude Code is going to start working — you'll see text streaming as it thinks through the design, writes the code, and assembles everything into one file. This is the fun part.
This might take a minute or two. That's normal. It's building an entire interactive dashboard — layout, styling, charts, data processing — all from one instruction.
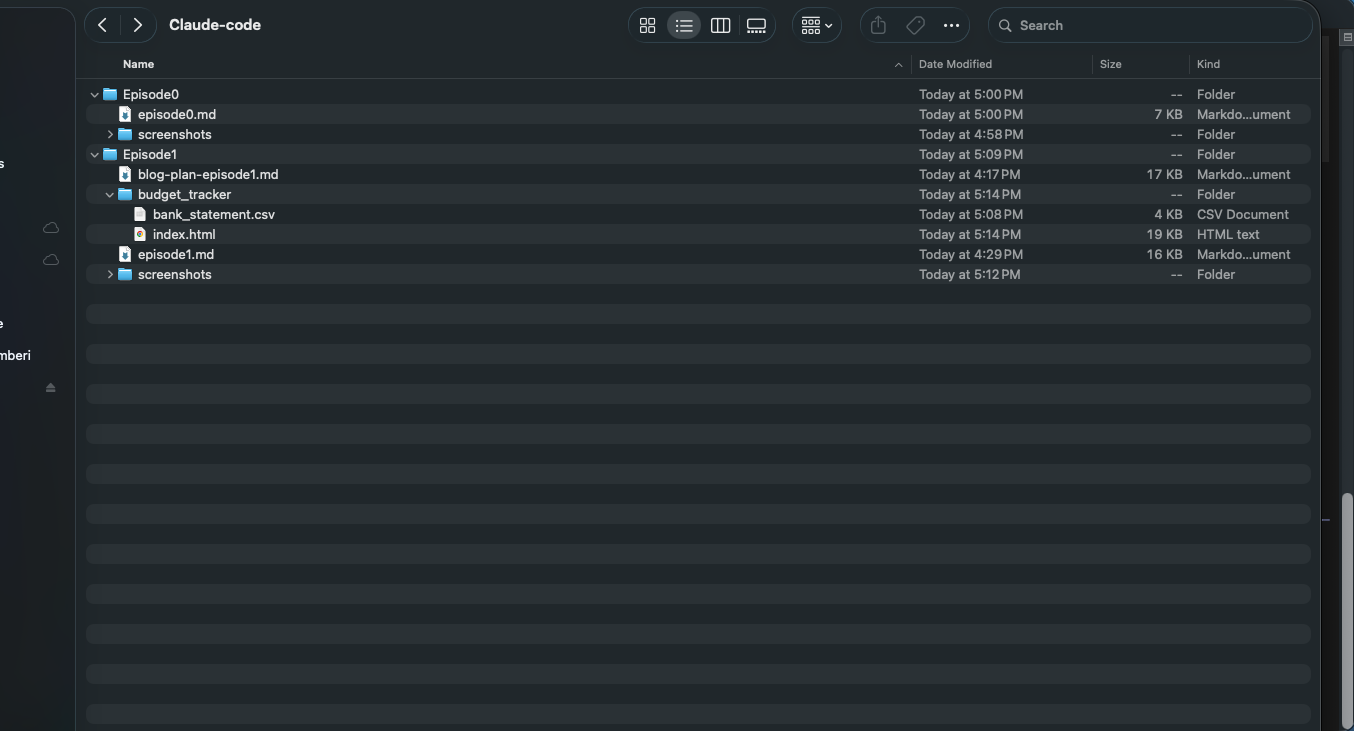
When it's done, you'll see a confirmation and a new file in your folder.
A few things to notice:
We were specific in our prompt. The more detail you give your developer, the better the result — just like briefing a real freelancer.
We asked for a single HTML file on purpose. This means everything — the layout, the styling, the charts, the interactivity — lives in one file you can open anywhere. No complicated setup. No extra software.
Step 3: See What You Built
Time for the reveal. Open your new app in a web browser.
The easiest way: find the HTML file in your regular file browser (Finder on Mac, File Explorer on Windows) and double-click it. It'll open in your default browser.
Or from the terminal:
- Mac:
open index.html - Windows:
start index.html - Linux:
xdg-open index.html
There it is. A fully functional, interactive budget dashboard.
Take a minute to explore:
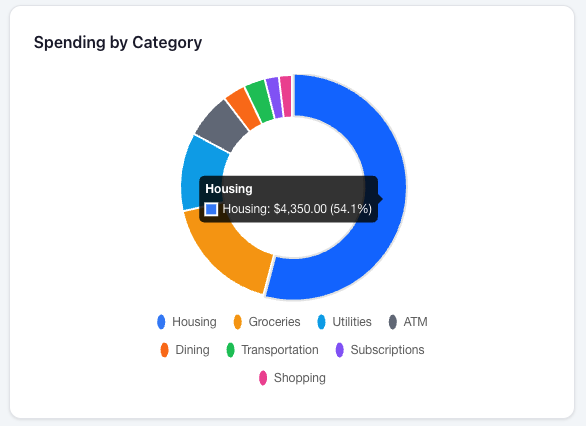
The spending breakdown chart — hover over the slices to see exact amounts per category. Your groceries, subscriptions, dining out — all visualized.
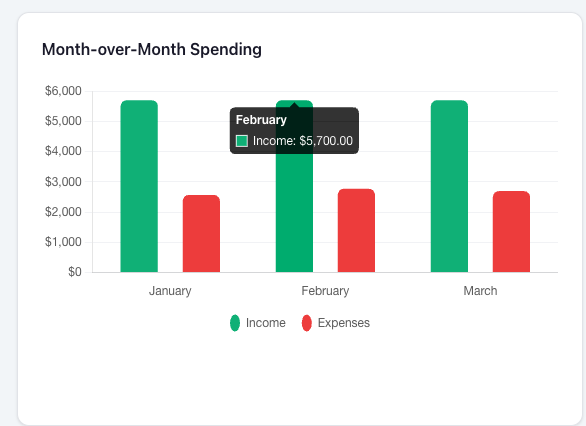
The monthly comparison — see how your spending changed from January to February to March. Any trends jumping out?
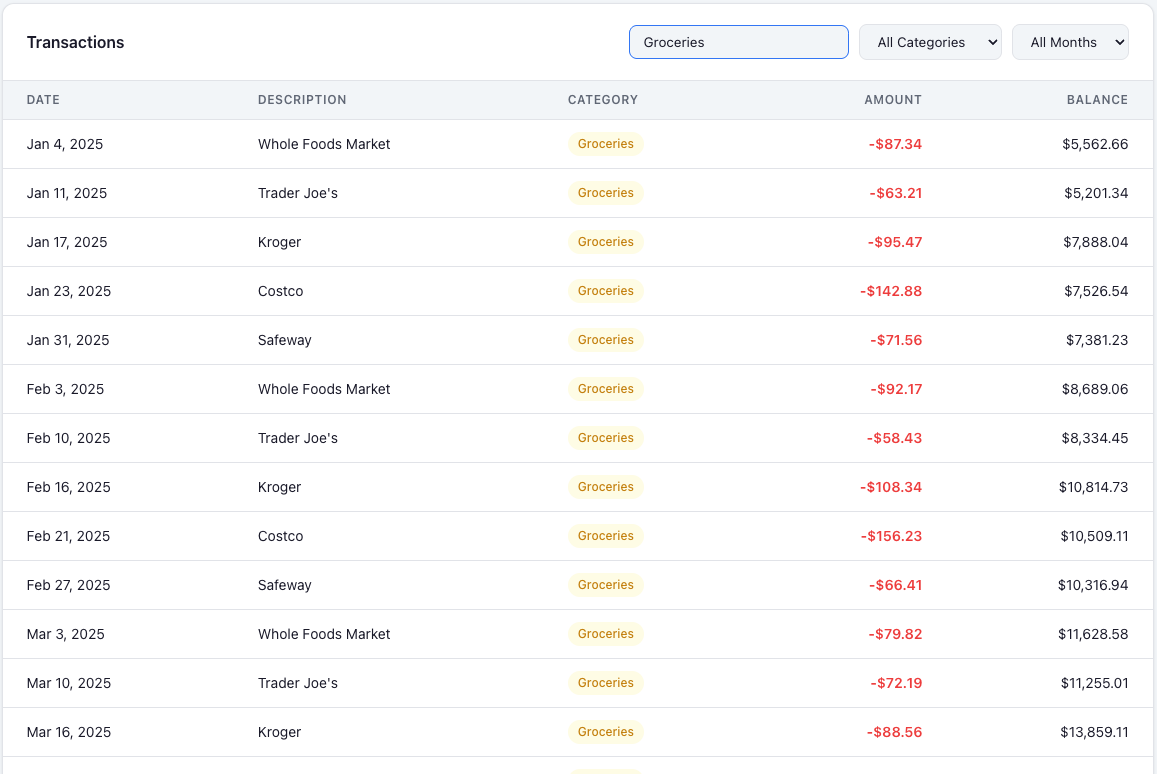
The transaction table — try searching for "Netflix" or filtering by "Groceries." Every transaction, searchable and sortable.
Take a moment. You just built a fully functional interactive prototype. Not a Google Sheet. Not a ChatGPT response pasted into a document. A real, interactive dashboard that runs in your browser.
Three months ago, building this would have required hiring a developer or spending weeks learning to code. You did it with one paragraph of plain English.
Step 4: Be the Product Manager — Request Changes
Here's where it gets really powerful.
You don't start over when you want changes. You iterate. Just like a product manager directing a developer — "add this," "change that," "make it better."
Claude Code remembers what it already built. Each new instruction builds on top of what's there.
Iteration 1: Add a budget goal feature
Add a "monthly budget goal" feature. Let me set a target monthly budget
of $3,000 and show a progress bar for each month indicating whether I'm
under or over budget.
Now you can see at a glance: did you stay within your $3,000 target each month?
Iteration 2: Make it look better
The dashboard looks good but make it more visually striking. Add a dark
mode toggle. Also make the charts animate when the page loads.
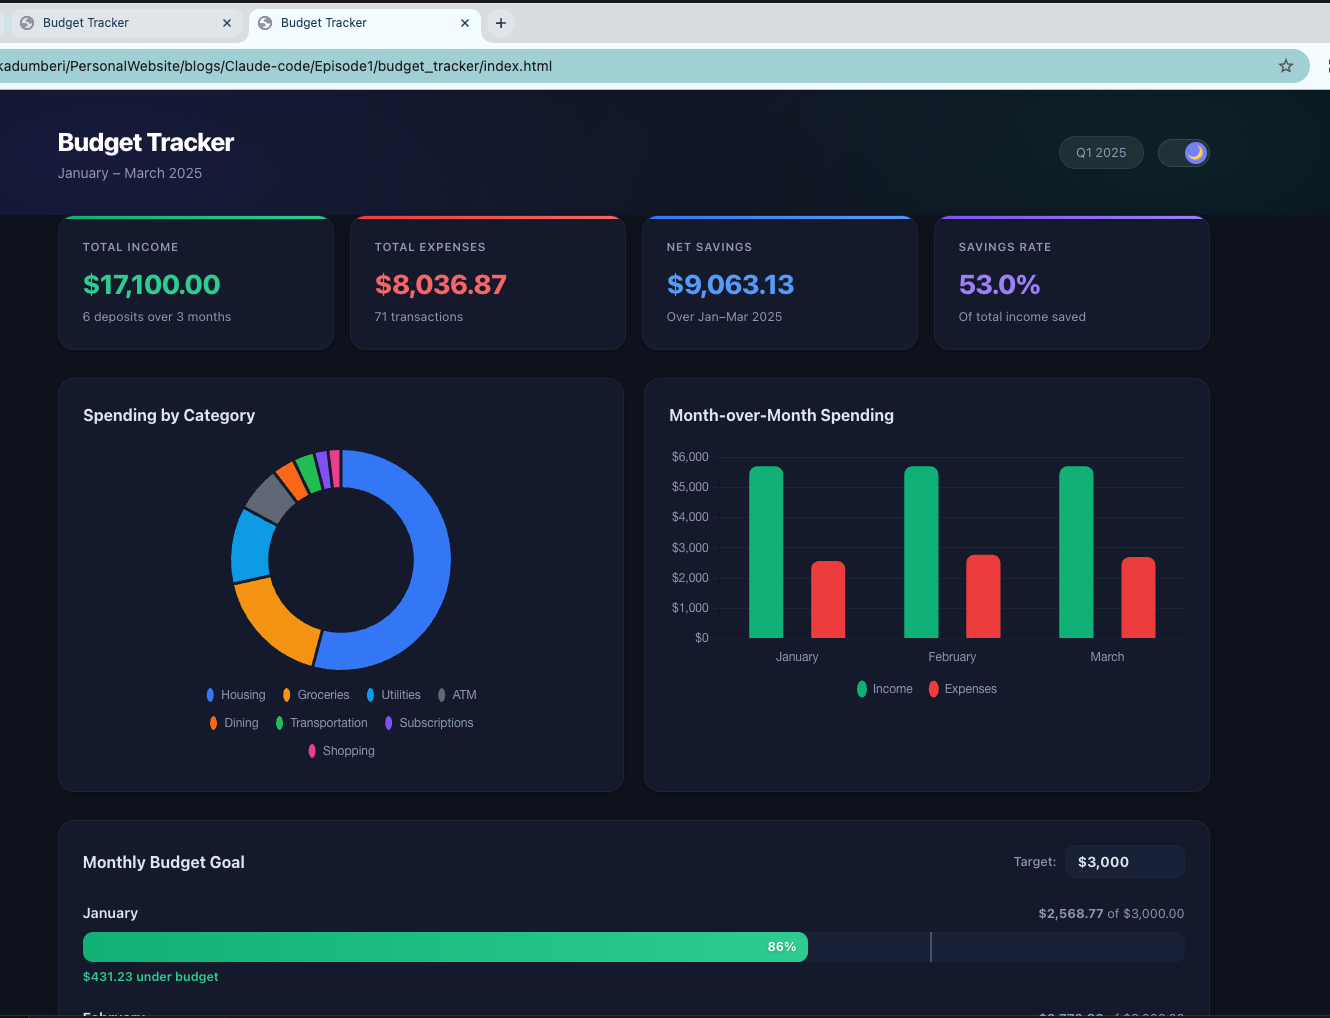
A dark mode toggle and smooth animations — the kind of polish that would take a professional developer hours to add. You did it in one sentence.
Iteration 3: Add a new visualization
Add a "daily spending heatmap" section — like a GitHub contribution
graph but for spending. Darker colors for days I spent more.
Now you can spot your big spending days at a glance. See that dark square? That's the day you paid rent.
Iteration 4: Make it smarter
Add an "insights" section at the top that automatically highlights:
- My most expensive day
- My most common merchant
- How my spending trended over the 3 months
- A simple prediction of next month's spending based on the trend
Your app now analyzes your spending and tells you what it finds. It's like having a financial advisor built into your dashboard.
This is the real superpower. You're not starting from scratch each time. You're having an ongoing conversation with your developer: "Add this. Change that. Make it better."
This is exactly how product managers work with engineering teams at real tech companies. The difference? Your developer responds in seconds, not days.
Note: Your version of the app will look different from mine — and that's totally fine. Claude Code makes its own design choices each time, just like two different developers would. The features and functionality will be the same.
Step 5: Make It Yours — Use Real Data
Everything so far used fake data. Now let's make it real.
Most banks let you download your transactions as a CSV file (a simple spreadsheet format). Check your bank's website or app — look for an "Export" or "Download transactions" option.
Once you've downloaded your real bank statement, put it in the same folder as your project, then tell Claude Code:
Replace the sample data with the data from my_real_statement.csv.
Adjust the categories if the column names are different. Keep
everything else the same.
Replace my_real_statement.csv with the actual name of your downloaded file.
Claude Code will read your file, figure out the format, and rebuild the dashboard with your real spending data.
A note about privacy
Here's something important: Claude Code sends your data to Anthropic's servers for processing. It needs to read your file and understand it in order to generate the code for your dashboard. The data is used to process your request and is handled according to Anthropic's privacy policy.
If you're comfortable with that, go ahead. If you'd prefer to be cautious, the sample data works perfectly for learning, and that's totally fine.
What Just Happened?
Let's step back and look at what you did today:
- You generated test data — something even many professional developers don't bother doing properly
- You built an interactive prototype with interactive charts, search and filter functionality, and a responsive design
- You iterated on it like a product manager — adding features, polish, and intelligence across four rounds of improvements
- You ran it locally on your own computer — a functional interactive dashboard, not a chatbot response
You didn't learn to code today. You learned something arguably more valuable: how to direct a coder.
You learned to think like a product manager, a founder, a technical lead — the person who decides what gets built and why. The person who has the vision. The "how" is handled for you.
What's Next?
Right now, your budget tracker lives on your computer. Only you can see it.
In Episode 2, we're going to take this app and put it on the internet — so you can check your budget from your phone, share it with your partner, or access it from any device.
You're about to go from "runs on my laptop" to "runs everywhere."
[Read Episode 2: Put Your App on the Internet (coming soon)]
Quick Reference: All the Prompts
Here are all the prompts from this tutorial in one place, ready to copy and paste:
Click to expand all prompts
Generate test data:
Create a realistic sample bank statement CSV file with 3 months of
transactions (January to March 2025). Include a mix of:
- Regular income (salary deposits twice a month)
- Rent/mortgage payments
- Groceries from different stores
- Restaurant and coffee shop visits
- Subscription services (Netflix, Spotify, gym)
- Utilities (electric, internet, phone)
- Gas station visits
- Some Amazon purchases
- A few ATM withdrawals

Make it realistic with varying amounts and dates. Include columns for
Date, Description, Category, Amount (negative for expenses, positive
for income), and Running Balance. Start the balance at $4,250.
Save it as bank_statement.csv
Build the app:
Using the bank_statement.csv file in this folder, build me a personal
budget tracker as a single-page web application (one HTML file with
everything included).

It should have:
- A clean, modern dashboard layout
- A summary section showing total income, total expenses, and net
  savings for the full period
- A breakdown of spending by category shown as a visual chart
  (pie or donut chart)
- A month-over-month comparison (bar chart showing spending per month)
- A transaction table where I can search and filter by category or date
- A "top spending categories" section highlighting where most money goes
- Color coding: green for income/savings, red for overspending,
  neutral tones for everything else

Make it look professional and polished. Use a modern sans-serif font.
The whole thing should work by just opening the HTML file in a browser.
No server needed. No installation needed. Just open and use.
Add budget goals:
Add a "monthly budget goal" feature. Let me set a target monthly budget
of $3,000 and show a progress bar for each month indicating whether I'm
under or over budget.
Add dark mode and animations:
The dashboard looks good but make it more visually striking. Add a dark
mode toggle. Also make the charts animate when the page loads.
Add spending heatmap:
Add a "daily spending heatmap" section — like a GitHub contribution
graph but for spending. Darker colors for days I spent more.
Add insights:
Add an "insights" section at the top that automatically highlights:
- My most expensive day
- My most common merchant
- How my spending trended over the 3 months
- A simple prediction of next month's spending based on the trend
Use real data:
Replace the sample data with the data from my_real_statement.csv.
Adjust the categories if the column names are different. Keep
everything else the same.
Troubleshooting
"My app looks different from the screenshots." That's completely normal. Like two developers given the same brief, Claude Code makes its own design choices each time. The functionality will be the same — the visual style might vary slightly.
"The charts aren't showing up." Try opening the file in Chrome. Some browsers handle certain chart libraries differently. Chrome is the most reliable.
"Claude Code gave me an error."
Just tell it: "That didn't work. Can you fix it?" Claude Code can usually debug its own work. If it's really stuck, try closing Claude Code (Ctrl+C), relaunching it with claude, and trying the prompt again.
"I want to start over." No problem. Delete the HTML file and give Claude Code the build prompt again. You'll get a fresh version.
"How much did this cost?" The whole tutorial typically costs between $0.50 and $2.00 in API credits, depending on how many iterations you try.
Built something cool? I'd love to see what you made — feel free to reach out and share it with me on LinkedIn.